One of the biggest questions any business owner is going to ask is whether their business is financially viable and what can be done to improve the bottom line. We take immense pride in seeing our idea become a reality, but without a steady income, long-term success is far from certain.
It is crucial for SaaS business owners to understand a different business model to that of traditional businesses. There are several variables that need to be monitored so that decisions can be made and improvements and/or growth can be seen.
Before looking into these variables, let’s take a minute to understand why SaaS businesses are different from others.
Why Is a SaaS Business Different from a Traditional Business?
SaaS businesses, like other subscription-based services, depend on recurring revenue. When a customer buys a new piece of hardware from a store, the revenue is received at the moment, a one-off payment, the stock levels reflect the number of sales, and the store restocks when necessary. This is the same in retail, food, and beverage, etc.
Those customers who aren’t happy will cancel, which is referred to as the churn rate. This is a huge problem for SaaS businesses. If a traditional business loses a customer, acquiring new customers is relatively easy. A SaaS business invests a lot of money into customer acquisition, so a high churn rate is extremely costly for them. For this reason, SaaS businesses must not only work on acquiring new customers but also retaining them. Then, business owners need to understand how to monetize customers to get the highest potential revenue from each one.
Knowing how to measure various metrics is what is going to help you gain a clear overview of your business situation. This will also provide you with the tools to make the right improvements, unlike what you would learn if you looked at your SaaS business as a traditional business.
Monthly recurring revenue
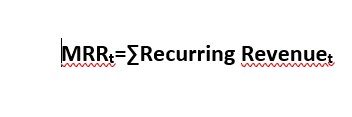
The Monthly Recurring Revenue formula is quite simple: for any given month (period t), just add up the recurring revenue generated by that month’s customers.
It’s not uncommon for a SaaS business to suffer from cash flow problems in the first few years. Imagine it costs your company $3,600 to acquire a new customer, but they pay a subscription fee of $300 a month. It is going to take one year before you cover the initial cost and start to see an ROI.
The cash flow is further complicated if you acquire multiple new customers at the same time. Ten new clients mean a $36,000 investment. At this point, you would be tempted to hold back on your client acquisition because your cash flow doesn’t look healthy. However, if you focus on the after the initial year, you will notice that the higher number of new customers you have, the faster your cash flow grows once the initial investment has been recovered.
Be careful not to look at just your monthly revenue as this doesn’t accurately reflect your situation. A traditional company may celebrate a record-breaking number of sales in one month. Still, a SaaS company has to focus on the future by considering the monthly recurring revenue.
Customer Churn Rate
Your churn rate is the percentage of customers your business loses. As this often reflects something we aren’t doing right, it may be a metric that we are tempted to brush under the rug. We should learn from our churn rate so that we can make the necessary changes and, therefore, improve our monthly recurring revenue.
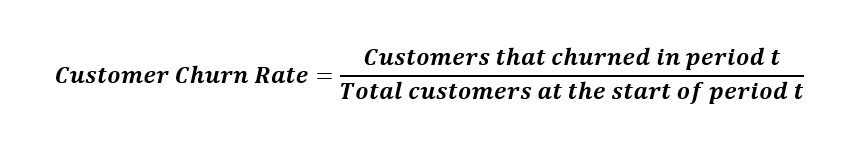
A churn rate is frequently measured on a monthly basis, but if your subscriptions are only biannually (for example), then you will calculate for the year. The easiest way to calculate your churn rate is by dividing the number of churned customers over a decided period of time by the number of customers you had at the beginning of this period.
A good churn rate for a SaaS business is 3-5% monthly. The general rule of thumb is that the larger your target businesses, the lower your churn rate should be. If you have an enterprise-level product, your churn rate should be less than 1% per month.
When a churn rate is in the double figures, it is essential that action is taken to finds out what is going wrong. There is little point in marketing when your churn rate is so high because you risk losing these customers before you have a chance to recuperate your investment. At this point, you need to work on getting feedback from your customers on ways to improve your product and/or service.
Customer Acquisition Cost (CAC)
Some of your advertising campaigns will be incredibly successful, while others not so much. These unsuccessful campaigns are going to tap into your profits, especially if your marketing strategies have been expensive. By understanding the cost er acquisition, you will be able to see if you are spending more money on getting a customer than you will receive from them.
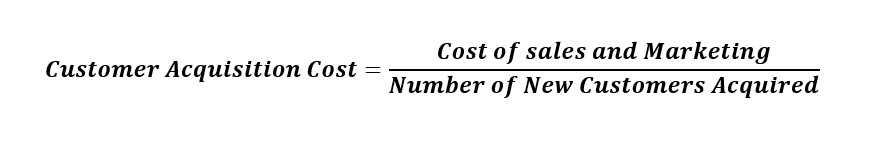
Take the figures from your total spending on sales and marketing for one month and divide this between the number of new customers you acquired in the same month. This is a good starting point to understand how much each new acquisition costs, but it is still only an average. If you want to improve this metric, it is necessary to calculate acquisition costs per campaign.
This becomes a little more challenging as you need to monitor the numbers over a longer period of time, and your numbers have to be more specific. You will need to be able to learn which customers come from each campaign and then divide the costs by this figure. To be able to do this, you will need to be on top of customer analytics.
It is true that this metric is a little more challenging to measure, but it is still crucial that you keep track of this, and more so for individual marketing campaigns. It is senseless to spend money on an advertising campaign that brings you very few customers when you could redirect those funds to more profitable campaigns.
The average revenue per customer
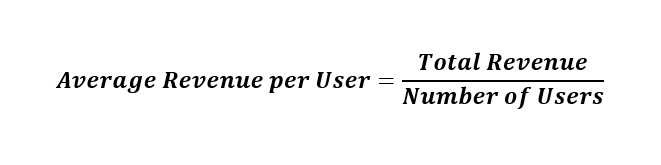
The average revenue per customer is relatively straightforward. You should have a detailed account of how much revenue you have already received from each customer. What is key here is finding ways to increase this revenue.
There are two fundamental ways to increase the average revenue per customer; up-sells and cross-sells. An up-sell is when a customer is encouraged to purchase a more expensive version of the product or available package. A cross-sell is an additional product that can add value to the original product they were interested in.
Let’s look at Dropbox as an example. Dropbox has three packages related to the amount of storage space available. The first is 100GB for $99 a year when billed annually. The up-sell is 200GB of storage space for $199 per month, increasing your average revenue per customer.
There is also what’s called a Packrat for $39 a year. This ‘extra’ offers unlimited undo history. This is an example of a cross-sell.
Annual plans are another way that you can increase your average revenue per customer. Annual plans mean that your cash flow takes a harder hit (as we saw in the monthly recurring revenue), and although customers are paying less than they would monthly, it also locks them in for a longer billing service, which has a positive impact on your churn rate.
Measuring this metric is a good way of monitoring whether you are gradually increasing your average revenue per customer or not. If not, it might be time to examine what cross-sells and up-sells you are offering and where they can be improved.
Lifetime value
While the average revenue per customer focuses on the revenue already earned, the lifetime value is an estimate of the revenue that will be received in total. We can only do this when you have calculated the average revenue and the churn rate.
Like many of our metrics, there is a simplified way to calculate the lifetime value and a more intricate way that will include cost per acquisition, the cost to service, and profit margins. For this, you will need more detailed reports from your financial department or accountant.
Here are two ways to calculate the Lifetime Value:
Lifetime Value = Average Value of Sale × Number of Transactions × Retention Time Period
Customer Lifetime Value = Average Value of Sale × Number of Transactions × Retention Time Period × Profit Margin
The first time you look at the lifetime value, you can take the average subscription length and multiply it by the yearly revenue per customer. Included in these calculations, you should add any potential costs like support and the initial acquisition cost.
** CLV= Customer revenue per year x Duration of the relationship in years – Total costs of acquiring and serving the customer **
By knowing the lifetime value of different customer groups and their products, you can better see which products are going to increase your bottom line in the future and where you should focus your efforts.
The Funnel
Technically speaking, this isn’t really a metric, but it is something that needs to be on the list of things to monitor. The Funnel or Marketing Funnel is the stage when an interested viewer becomes a paid customer. Here is what a typical Funnel looks like:
- A person visits your site to learn more about what you offer
- They will sign up for a free trial
- When they try the key features of your product, they move through to activation
- Finally, we hope that they will upgrade to one of the paid plans available
If you can track how many people in each stage of the Funnel, you can learn which areas of your marketing need to be improved. So, for example, if you get plenty of traffic to your site but few people signing up for the free trial, you know that you are missing that extra edge that motivates the visitor to sign up. Is the process easy enough? Have they seen a demo of your product and understand it properly?
In Conclusion
Because of the different business models, it is not always easy to convince partners and investors that your situation is not as dire as it looks based on just one or two metrics. For a SaaS business, it is essential to stay on top of all the metrics mentioned and discover ways to improve each one for a healthier and more profitable business.