This article will discuss how to implement charts and graphs in Ruby on Rails 6 applications.
1
| rails new chart tutorial
|
1
2
| rails g scaffold Order price:integer status:string
rails db:create db:migrate
|
1
2
3
4
5
6
7
8
9
10
11
12
13
14
15
| # db/seeds.rb
5.times do |i|
order = Order.create(price: 100 * i, status: 'dispatched')
order.update(created_at: order.created_at - i.day)
end
5.times do |i|
order = Order.create(price: 100 * i, status: 'pending')
order.update(created_at: order.created_at - i.day)
end
5.times do |i|
order = Order.create(price: 100 * i, status: 'delivered')
order.update(created_at: order.created_at - i.day)
end
|
1
| yarn add chartkick chart.js
|
1
2
3
| # app/javascript/packs/application.js
require("chartkick")
require("chart.js")
|
1
2
3
4
| # app/javascript/packs/application.js
gem 'groupdate'
gem "chartkick”
|
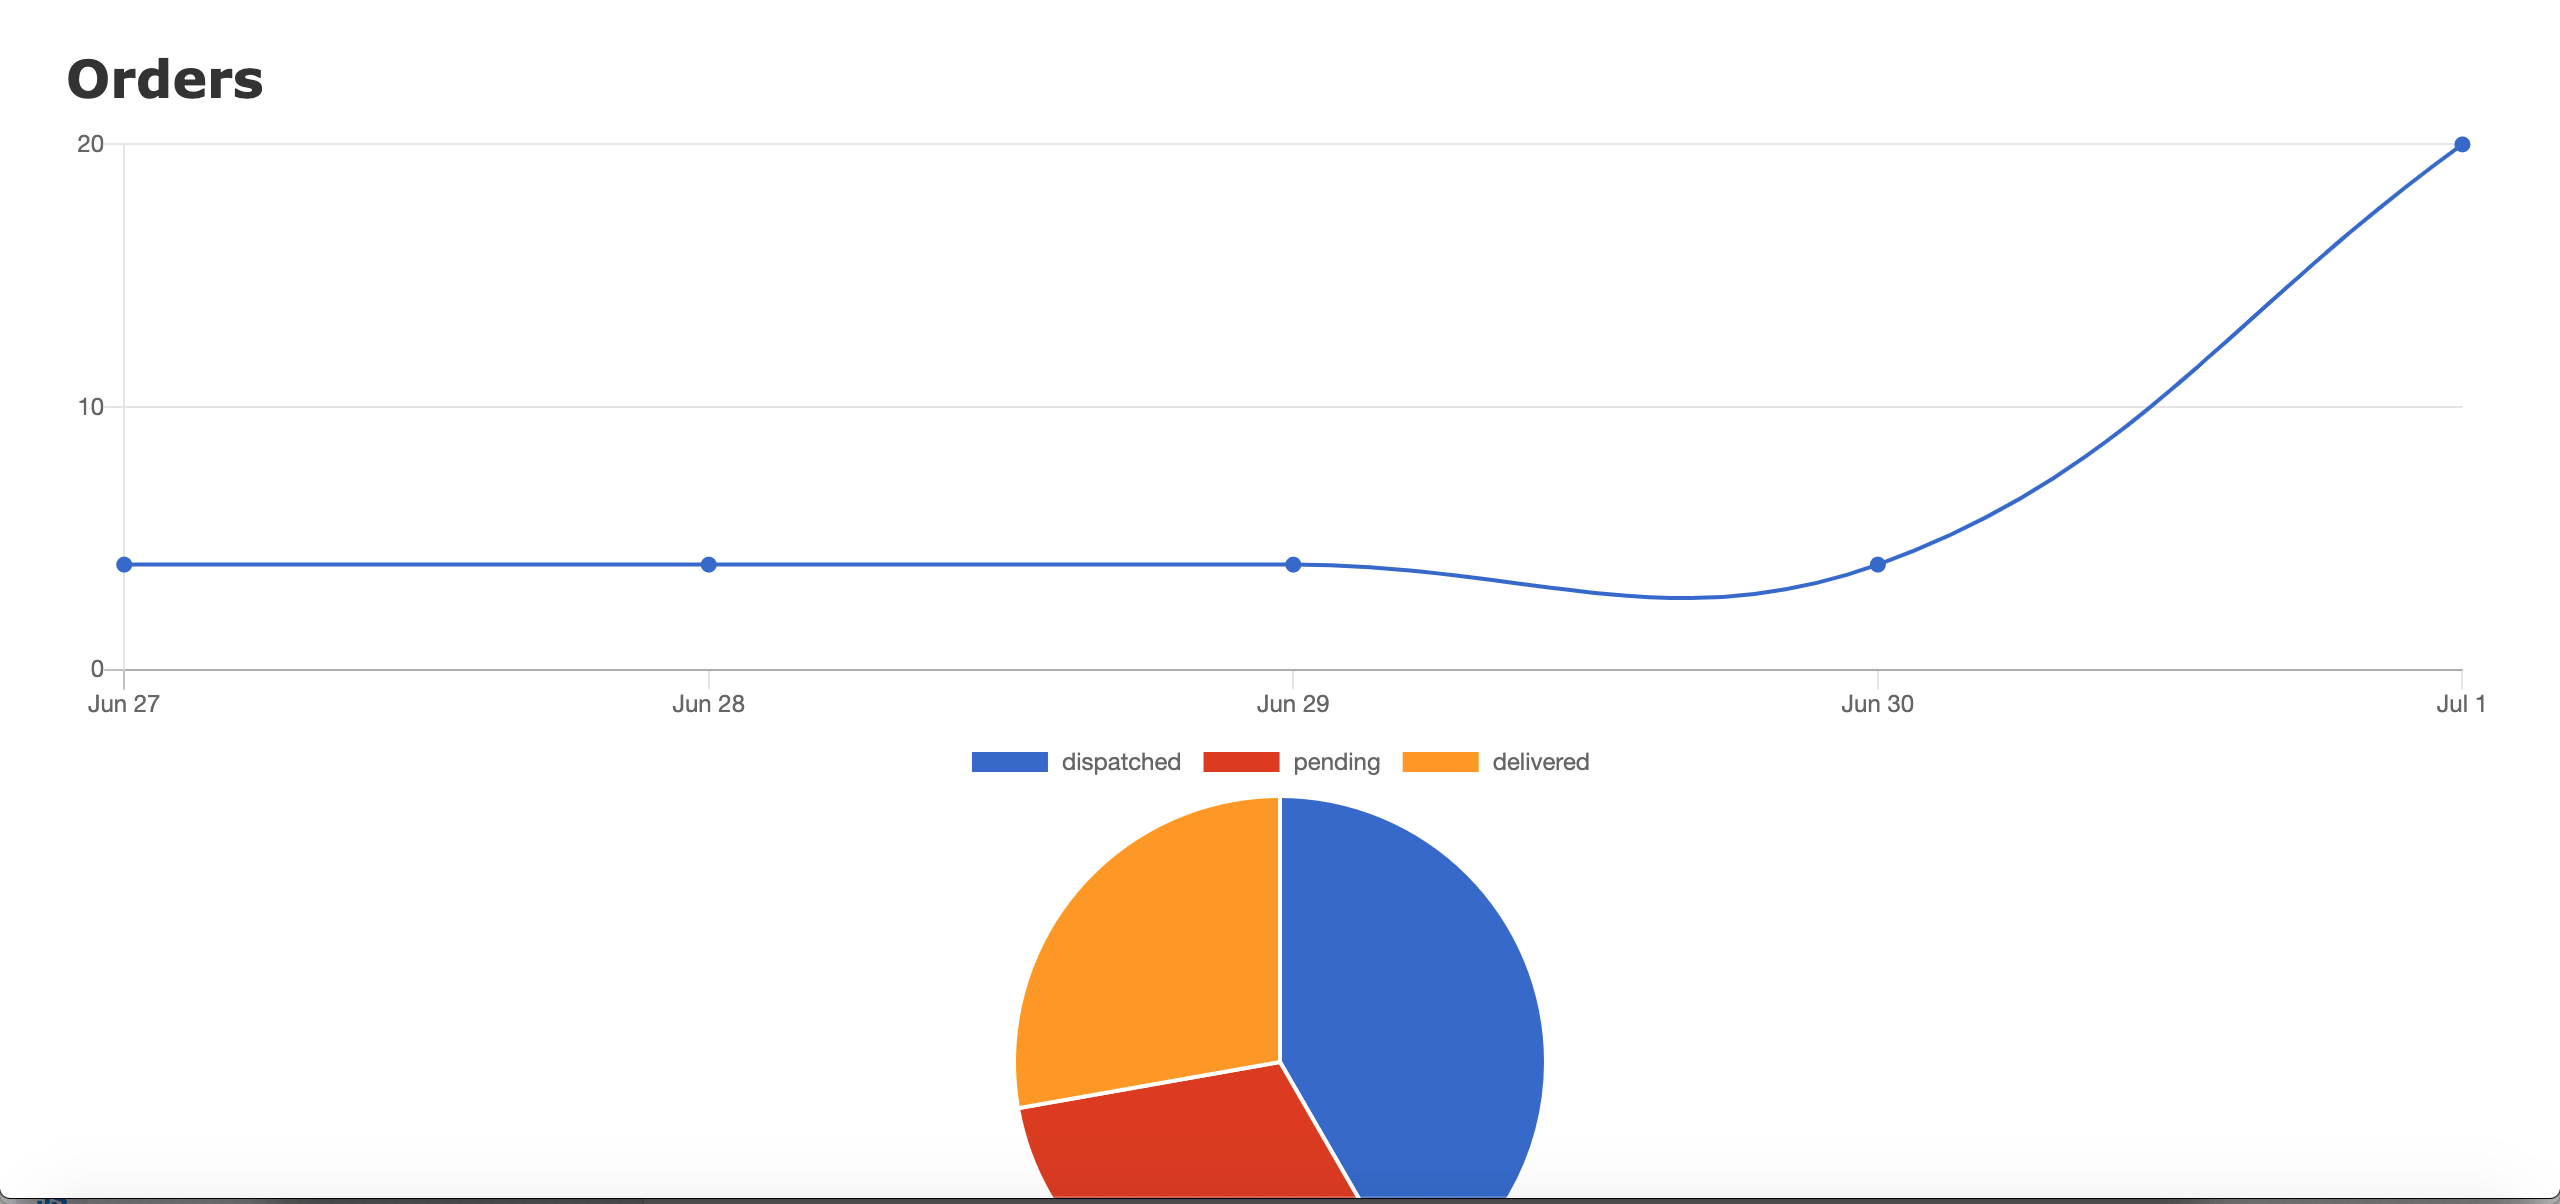
1
2
3
4
| # app/views/orders/index.html.erb
<%= line_chart Order.group_by_day(:created_at).count %>
<%= pie_chart Order.group(:status).count %>
|
Open http://localhost:3000/orders and you should see something like this: