If you’ve ever heard of the butterfly effect, you know that every little action is interconnected, especially with SaaS. Every single interaction along the customer journey impacts an array of metrics determining the health of your business. This is highly relevant for customer retention; there is no one customer interaction responsible for keeping your customer happy. Instead, retention is a byproduct of the overall efforts of your entire enterprise.
This is why companies must now collect and interpret critical product and customer-related metrics to create concrete action plans. Think, for example, of the benefits of understanding how onboarding directly impacts retention or how customer success is decided during initial interactions outside of the product.
Identifying Company-wide Metrics
The path to retention and customer success is a long-winded one, in which every part of your team has a role to play. Due to its complexity keeping an eye on all the SaaS metrics in a company’s dashboard is critical since every single unit can influence your analytics. Analytics would determine the effectiveness of your strategic decisions and illustrate the best way to move forward.
Do make a point not to confuse metrics with key performance indicators (KPIs). The former are quantitative data collected along the company journey to measure behavior. The latter is set to measure performance and come with targets and benchmarks for analysis. Metrics are more generic measurements and can be used to make decisions on KPIs.
Here a compiled list of possible metrics to monitor in a comprehensive SaaS dashboard.
##Customer Care/Product Management Metrics
MRR/ARR
Monthly/annual recurring revenue can monitor the overall performance of a company by measuring predictable revenue streams. This is the most basic metric, but it’s only a snapshot and makes it hard to define trends. You’ll need further churn waterfall and cohort projections to define growth rates and produce efficient accounting.
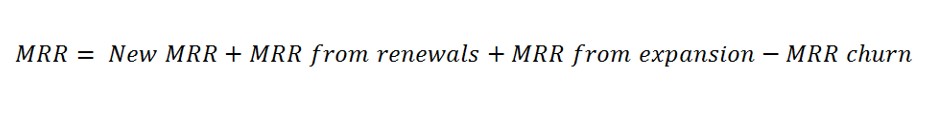
Because of the delays between onboarding and revenue, SaaS companies should also include CMRR (committed MRR) in their projections, although this makes for an even blurrier picture and can still be deceiving by only depicting the situation at a given point in time.
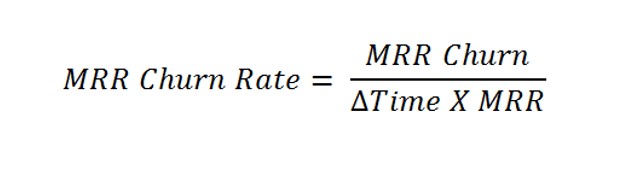
MRR Churn Rate
SaaS MRR churn assesses the erosion of MRR as a result of downgrading or customer churn, which is pertinent for the entire company for it can be caused by customer behavior and engagement. (Note that customer churn rate and MRR churn rate can be very different depending on customer segments and different pricing options).
In general:
Customer Acquisition Cost (CAC)
This metric is the sum of all marketing and sales costs that lead to new customer acquisition.
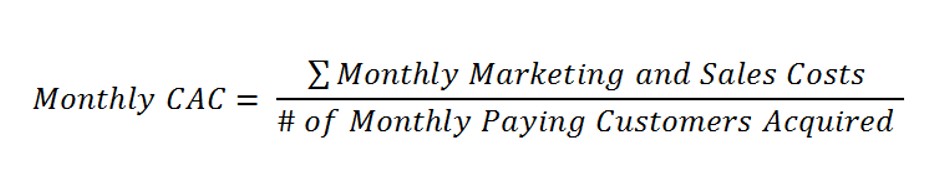
Because of the overall dynamic movements of the metrics, it will be more useful to normalize this value over a longer period.
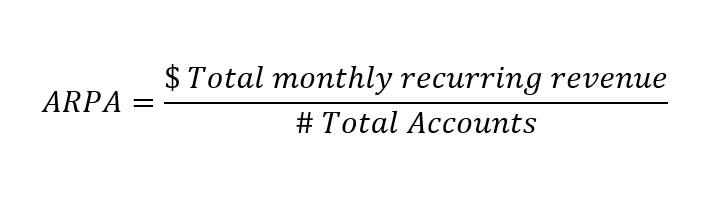
Average Revenue per Account (ARPA)
The average value of a monthly contract with a customer is defined as ARPA. Again, the whole company should care about this metric, since clients who engage and commit more will generate more value.
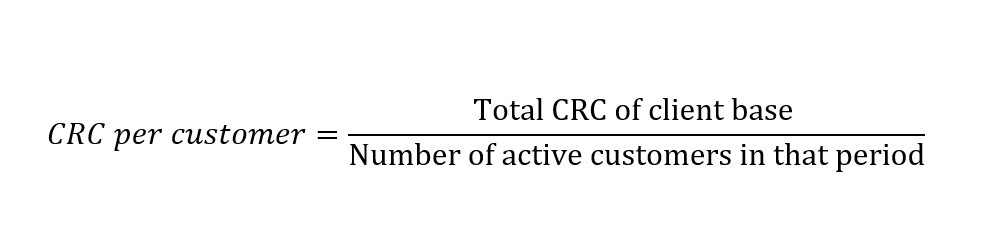
Customer Retention Cost (CRC)
CRC can be calculated on a yearly or monthly basis, as long as you remember to base yourself on the retained customers and not your general customer base. Average retention costs should always be lower than acquisition costs.
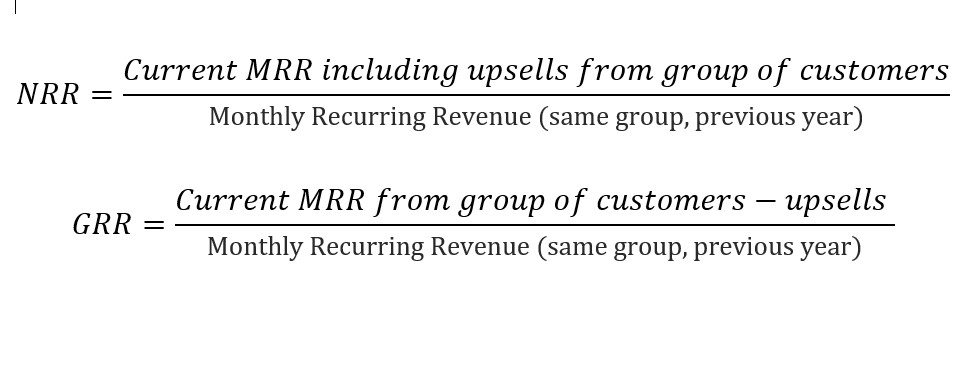
Revenue Retention Rate
This designates the recurring revenue your organization retains over some time. The revenue retention rate can be calculated as gross (without considering any lost revenue) or net (considering upsells and expansions).
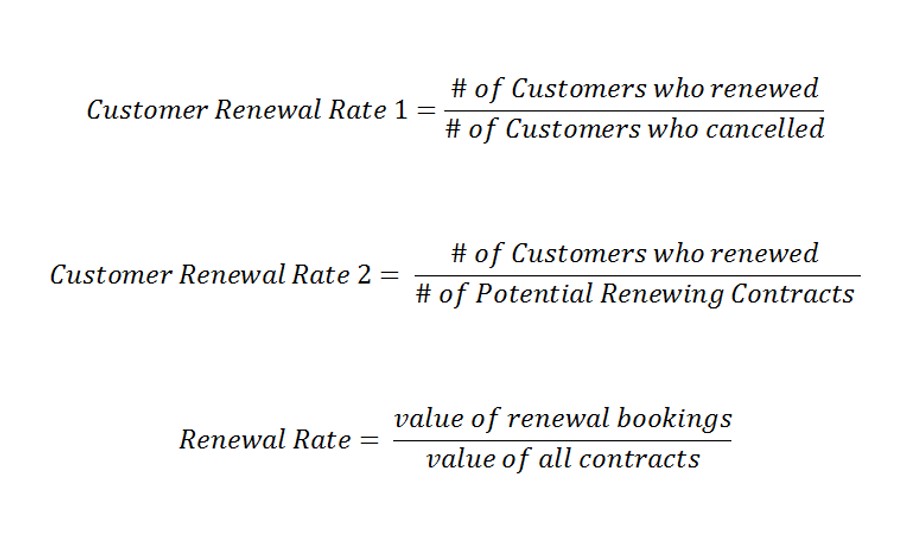
Renewal Rate
Generally speaking, the renewal rate measures the percentage of renewable revenue added through renewals within a time frame. For Customer Renewal Rate, this would designate customers who renewed their subscription in comparison to customers who canceled. Financially, you could also consider the monetary value of renewal bookings divided by the monetary value of all renewing contracts. Overall, there are multiple ways to calculate RR:
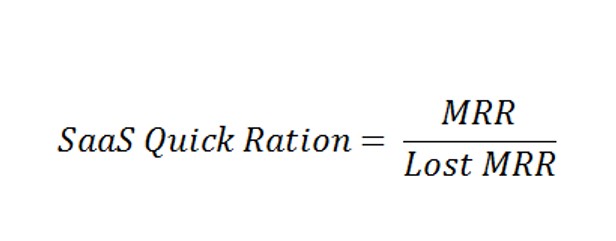
Quick Ratio
This metric measures the growth efficiency of a SaaS company pinpoints the efficacy of operations from acquisition to retention by measuring revenue growth compared to revenue churned. The higher the resulting value is, the healthier the company is.
Lifetime value (LTV)
Customer lifetime value is the average gross revenue generated by a customer over the retention period, determining the capped value for CAC to break even and generate profit.
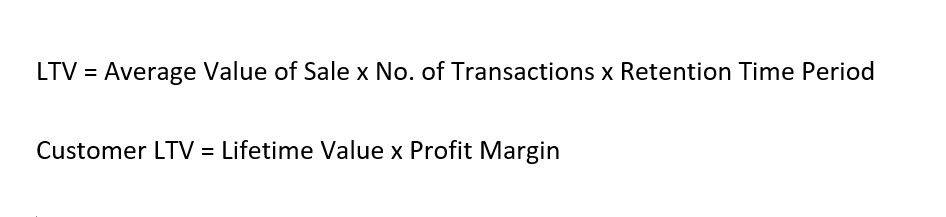
This formula is only a ballpark figure, which doesn’t take into account expansion, contraction, or the fact that churn isn’t linear.
Product Metrics
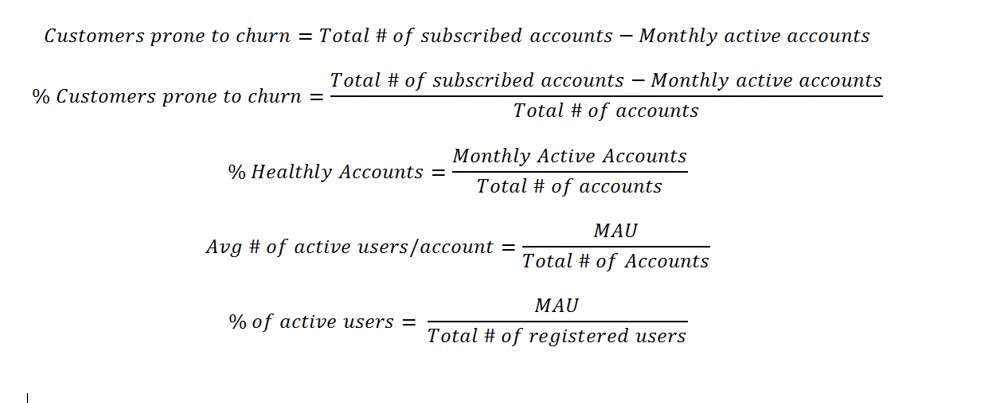
Active Users (DAU and MAU)
Daily and monthly active users (DAU and MAU) offer insight on how many people actually use your solution, indicating engagement and activation. This measure of stickiness can also help you define how many customers are prone to churn. From these key numbers we can derive an array of interesting metrics:
There are yet other ways to look into customer engagement and activation; such as the number of sessions per user, the median number of sessions, sessions per day (activation), time spent in the product, and session duration (per cohort).
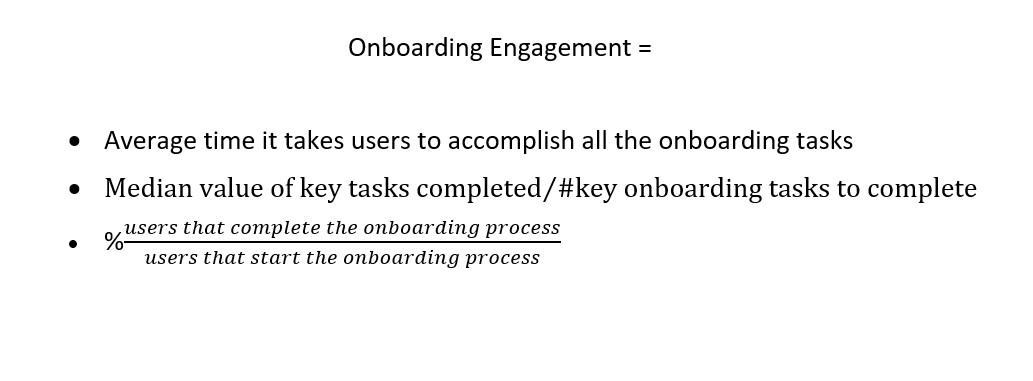
Onboarding Engagement
Churn is directly linked to onboarding, making it a key area of focus and prompting you to invest in onboarding process activation and retention capabilities strategically. There are various ways to calculate engagement during onboarding – one of them is going through a list of vital tasks that need to be completed to start using a product efficiently and estimating how often and how fast users go through the entire checklist.
According to a study conducted by Groove, customers who go through the most critical onboarding steps within 24 hours are 80% more inclined to convert in the long-term. Here are a few of the ways to calculate onboarding engagement:
Product Adoption
You can then identify Product Adoption, which is the combined effort of successfully onboarding new users and retaining existing customers.
Product Adoption = Growth + Retention
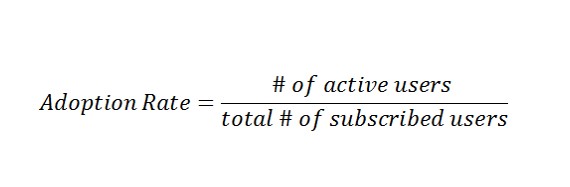
Rate of Adoption
After having identified active users, you’ll also be able to determine your adoption rate.
User Engagement Metrics
After defining behavioral patterns connected to the features you offer, you can introduce an array of other metrics of user engagement, such as:
- D1, D7, D30, W1 Retentions, which indicate the percentage of active users after one, seven, and 30 days after signing up.
- Time to Value measures the time it takes for a customer to get from signup to first results and to that famous “aha moment”
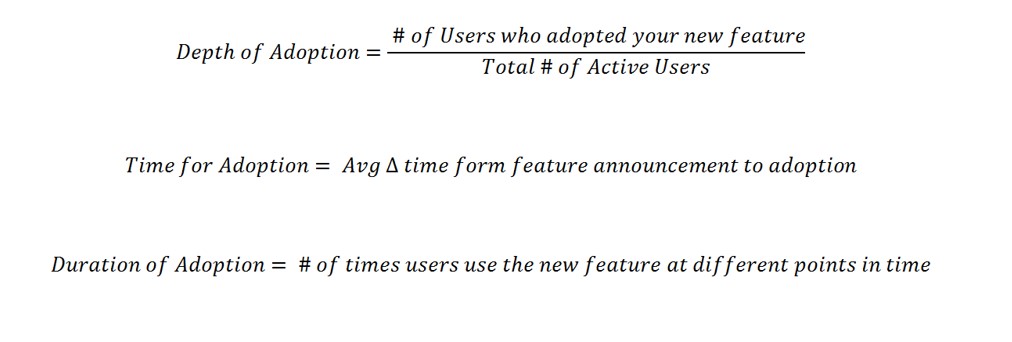
- Feature Adoption, which calculates how many active users test your new features when it is released, measuring your announcement efficacy. A thorough feature adoption analysis will consider the depth of adoption, the time for adoption, and the duration of adoption.
This is as always possible to use by differentiating customer segments if you are looking to target a specific group.
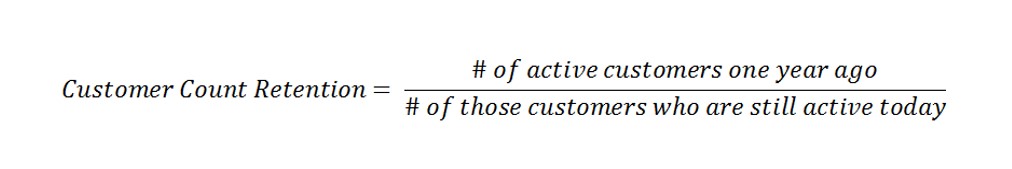
Customer Count Retention
Customer retention is still the most robust growth engine for SaaS companies, making the customer retention rate useful to monitor a company’s overall health.
Net Promoter Score (NPS)
An easy way to determine customer success is by asking users how likely they are to recommend your product on a scale of 0 to 10, subdividing them into three categories (0-6 = detractors; 7-8 = neutral; 9-10 = promoters).
NPS = % of Promoters - % of Detractors
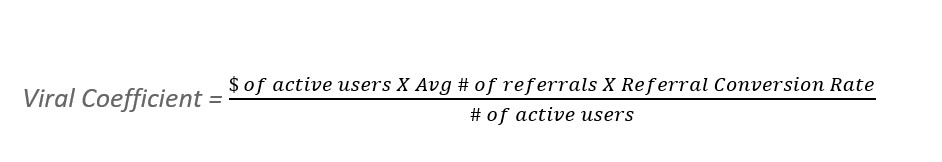
Advocacy (Viral Coefficient)
Directly connected to the NPS, the viral coefficient measures referrals instead of simply showing the potential number of promoters.
Net Easy Score
Your customers might encounter specific irritation points along the journey, which you need to monitor and work on to avoid potential churn. Adapting the customer’s efforts for planning purposes is defined as:
Customer Health Score
The overall customer health score can be linked to an array of different engagement and activation indicators, which you can automate to gather granular data. It can go from 0 to 100 and will allow you to set specific thresholds that will trigger intervention when customer health scores decrease or dip below a certain limit. While it can help you foresee churns and renewal, don’t forget to give each contributing factor the proper weight so that your actions will be appropriately planned.
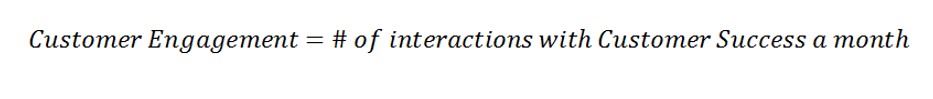
Customer Engagement
This simply refers to the frequency of interaction between a customer and a customer success team and can encompass a wide range of channels and platforms.
Sentiment Analysis
While gathering CES, NPS, and CSAT data will always provide useful numbers, .it’s also important to measure customer satisfaction by monitoring social media, blogs, review sites, and forums and using the voice of the customer (VOC) programs to carry out a sentiment analysis through
Trial-to-Paid Conversion Rate
This is once again pretty self-explanatory and indicates how efficient your onboarding process is. This overarching metric evaluates how efficiently your company works at different levels of the onboarding journey and should be valued by all teams.
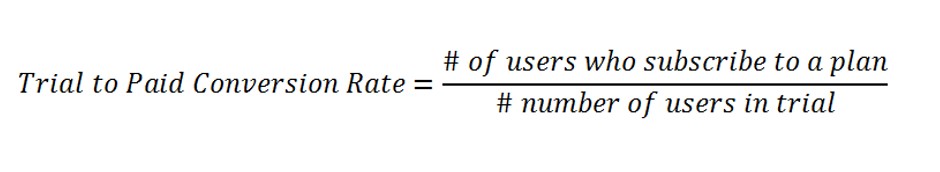
Once again, you can monitor this value by customer segments to be able to steer marketing towards those customer segments that have a higher conversion rate.
Customer Adoption
Adoption designates all that happens between onboarding and first renewal. Its metrics can be found within the metrics found in the Product Metrics part. This measure will have more general results, mapping the entire customer lifecycle.
Time to First Response
This will be a time value indicating how long it takes to get in touch with a customer the first time they contact support. It focuses on the first time because of how crucial the first impression always is. Automation and AI are essential tools, leading systems to dramatically decrease time to first response and create customers who expect short delays.
Conversational bots and automatic ticket management tools that deal with easy queries have also raised the general level away from auto-reply messages inviting customers to wait for a reply. Looking at reply time will also be an interesting way to monitor efficiency.
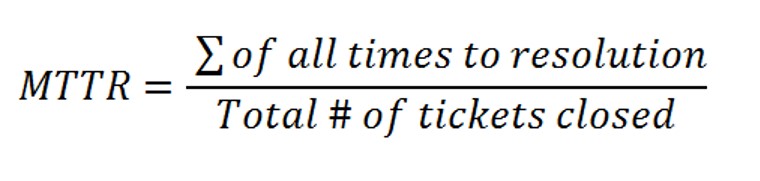
Mean Time to Resolution (MTTR)
This value, which is tied to customer satisfaction, is also inversely proportional to it. It calculates the average amount of time that it takes for the support team to close a ticket after a support request. You might want to take into account only normal business hours when calculating the actual time to resolution unless you have an international customer support team that provides 24/7 support across timezones.
Customer satisfaction (CSAT)
Making a happy customer isn’t merely about making sure they don’t experience any problems. It’s also about ensuring that your customer base feels supported through any query they may have. It is a sense of company trust that will be most important when trying to increase customer success, retention, and advocacy.
The CSAT value is two-fold, measuring customer satisfaction with your response time and the content of your answer. This can be collected through a post-support query survey with simple YES/NO questions or more detailed opportunities for customers to give feedback.
Help Center Article Rating
This is already widespread across most major services – it’s about allowing the customer to rate the usefulness of a piece of content. Asking for feedback on a specific article will help you define how accurate your SEO and keyphrases are as well as how thorough and up to date your articles are.
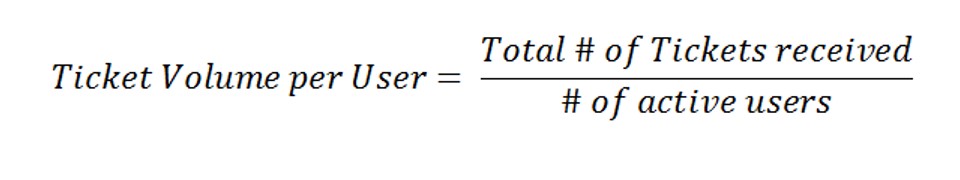
Ticket Deflection / Ticket Volume per User
This simple absolute value indicates the number of tickets a user submits as well as how that number evolves over time. This can be crucial in facilitating ticket deflection, which will save a lot of costs in the long run. However, it would be best if you offer in-app guidance to avoid the distraction and frustration of having to leave the working platform to get help.
Most Common Issue (MCI)
Customer queries are usually tagged according to a specific list of labels, which can be ‘billing issue,’ ‘bug report,’ ‘UX issue,’ ‘feature request,’ or many more, depending on your particular business. You’ll be able to prioritize needy projects and steer an action roadmap towards where it is most needed if you’re able to define which issue is most often reported.
Final Remarks on Customer and Product Metrics
This ocean of customer care and product metrics can be overwhelming. But you should remember that not all of them might be relevant to you, and the most important thing will always be to plan carefully, assess your needs, and pick and choose whatever tools will facilitate your decision-making processes and help you get to know your customer base.